Reports
Reports
A report is a polished, shareable page of widgets backed by your datasets — the equivalent of a dashboard in other BI tools.
What is a report?
A report is a freeform grid of widgets — KPI tiles, tables, charts — laid out on a responsive canvas. Each widget points at a dataset (or an inline query) and renders a single visualisation of that data.
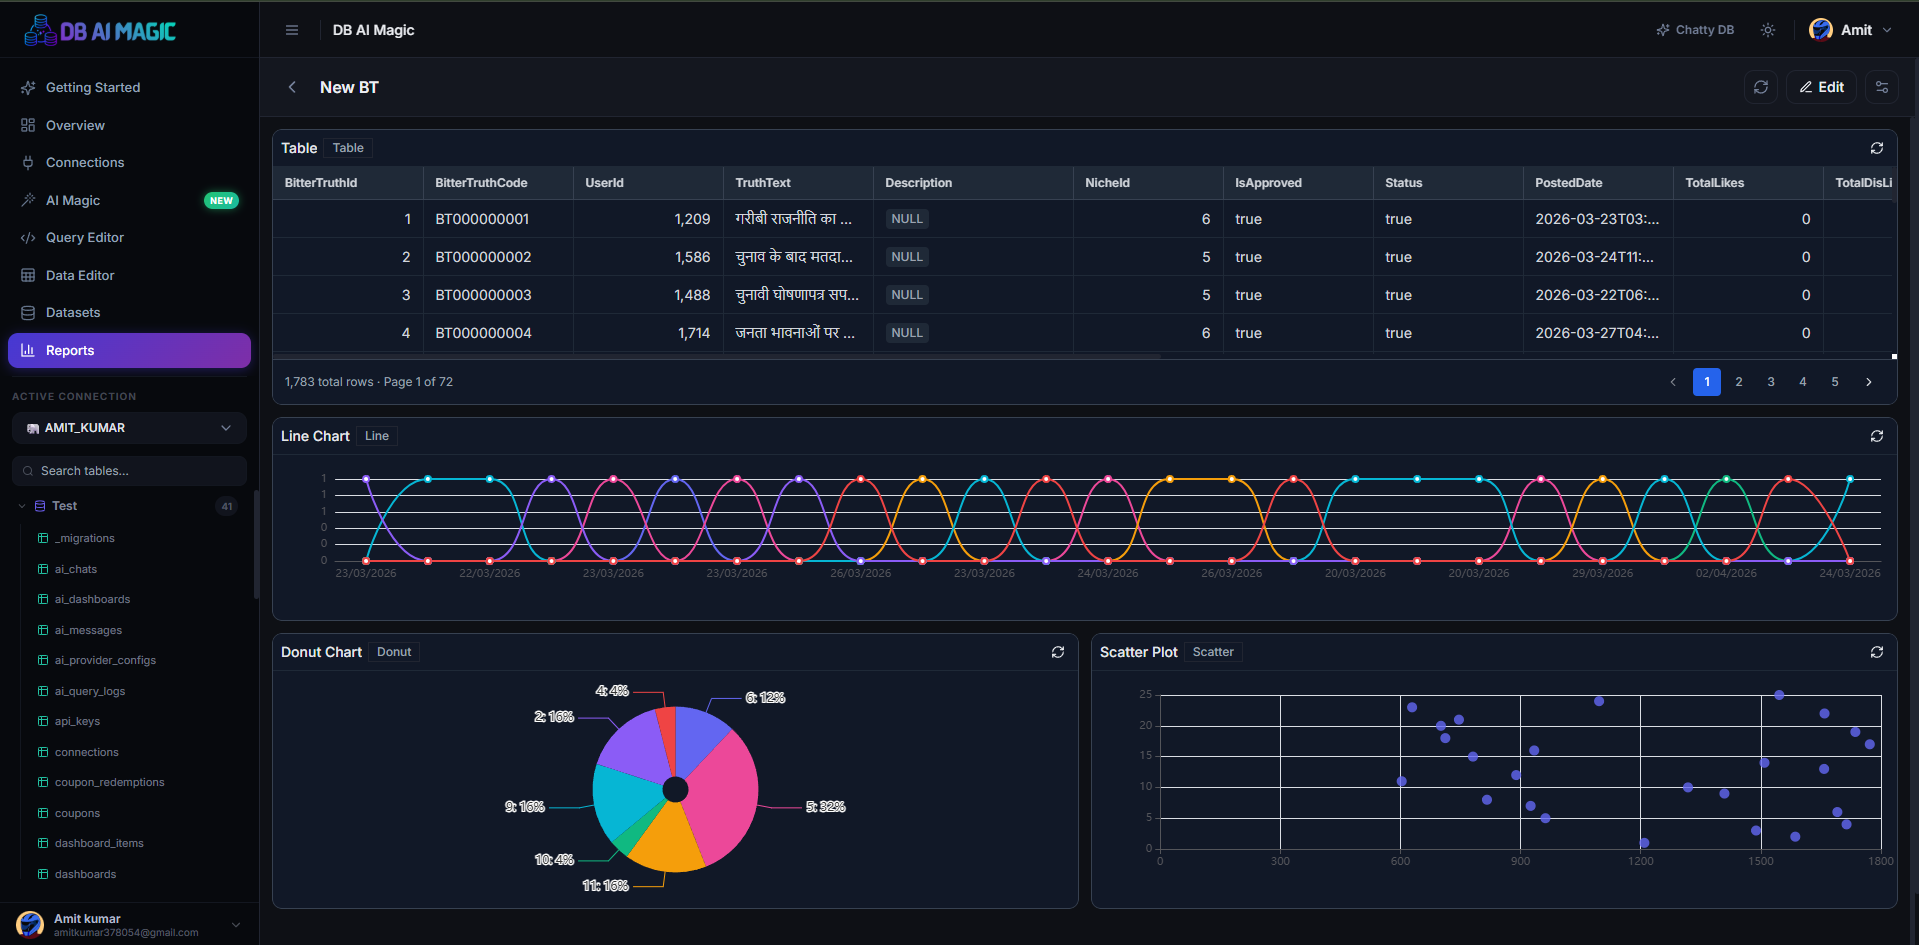
Anatomy of a report
- Header — title, description, status pill (live / cached / failed).
- Filter bar — global filters that propagate to every widget that subscribes.
- Widget grid — drag-and-drop layout you build once and re-arrange any time.
- Actions — export PDF, refresh, share, duplicate.
Filters
Filters live on the report (not on individual widgets) and can be bound to any compatible column across widgets. Add a Date range filter once and every chart with a date column updates as the user changes it.
Sharing
- In-app — teammates with access can open the report from the Reports hub.
- Public link — generate a tokenised URL anyone can open without an account. Revoke the token at any time to kill the link.
- Embed — drop the public link inside an iframe in your intranet or wiki.
Public reports are public
Scheduling
On the Team plan you can schedule a report to be rendered to PDF and emailed to a list of addresses on a cron schedule. Useful for the Monday morning “state of the business” email.
Continue to Creating a Report to build your first one, or Widgets for a breakdown of widget types.