Reports
Creating Reports
Build a report from scratch — pick a dataset, add widgets, attach filters, save.
Before you build
You'll get the cleanest results when you have at least one dataset ready that contains the columns you want to chart. If you don't, start with Creating a Dataset first.
Step-by-step
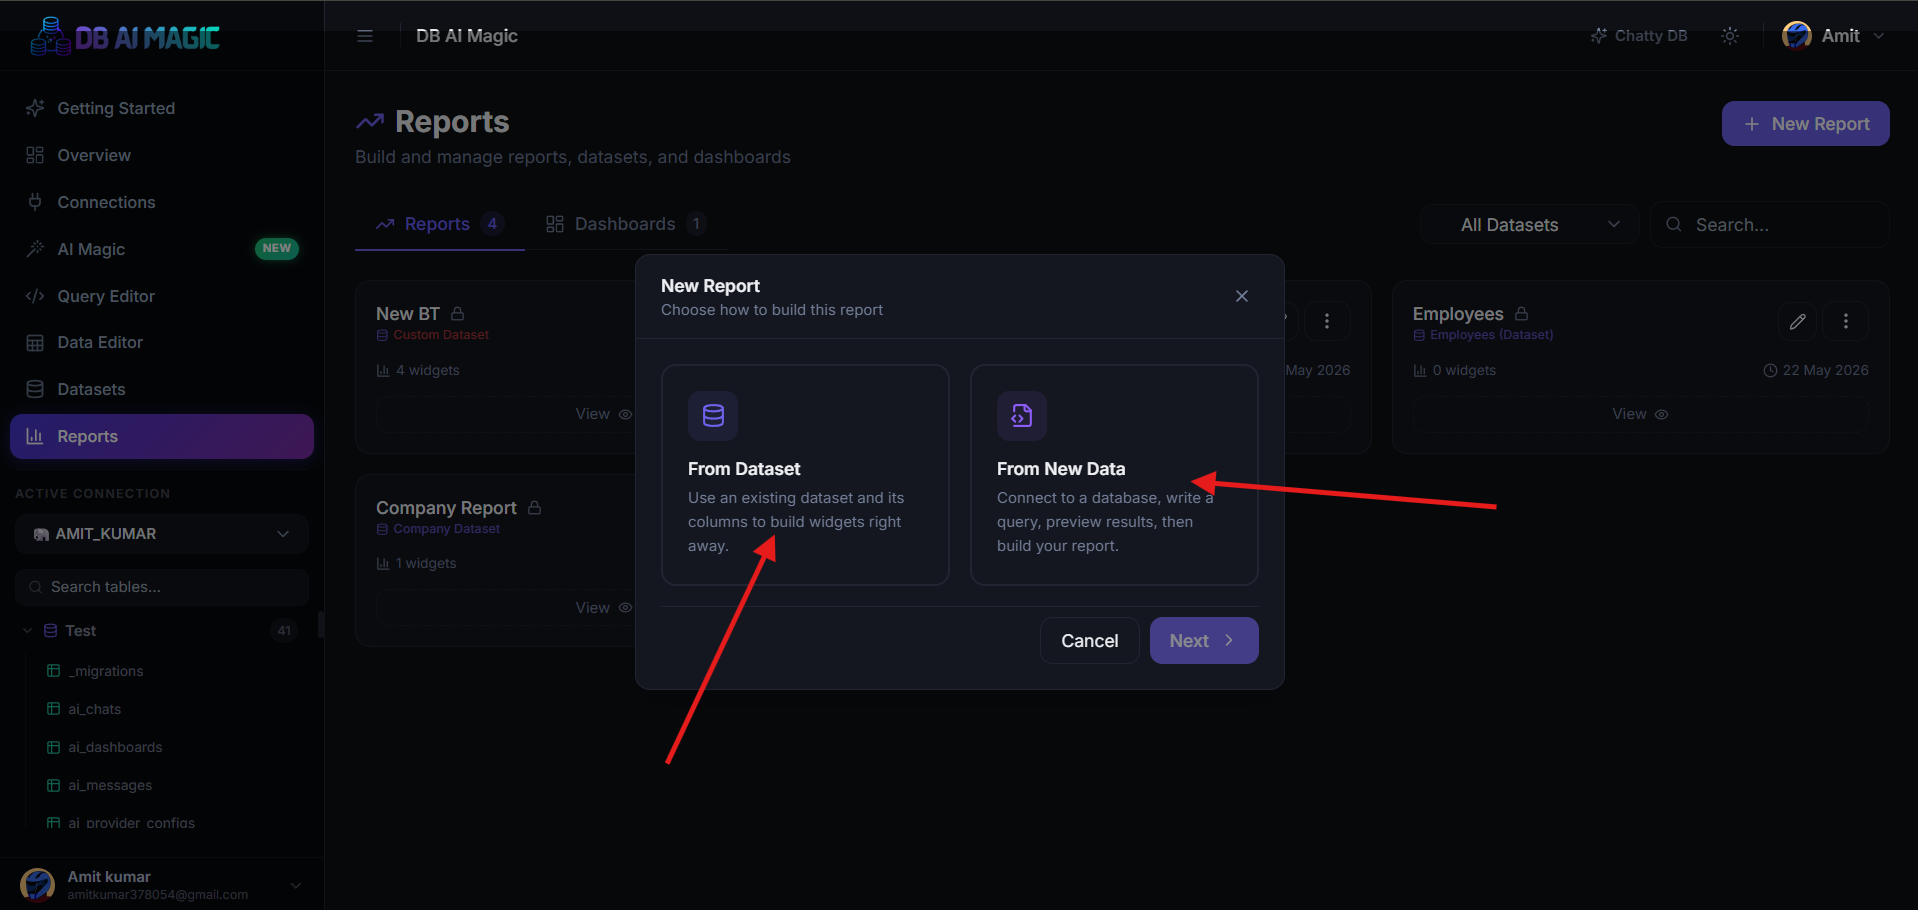
Open Reports
Click Reports in the sidebar, then New Report.Pick a dataset or create a new one
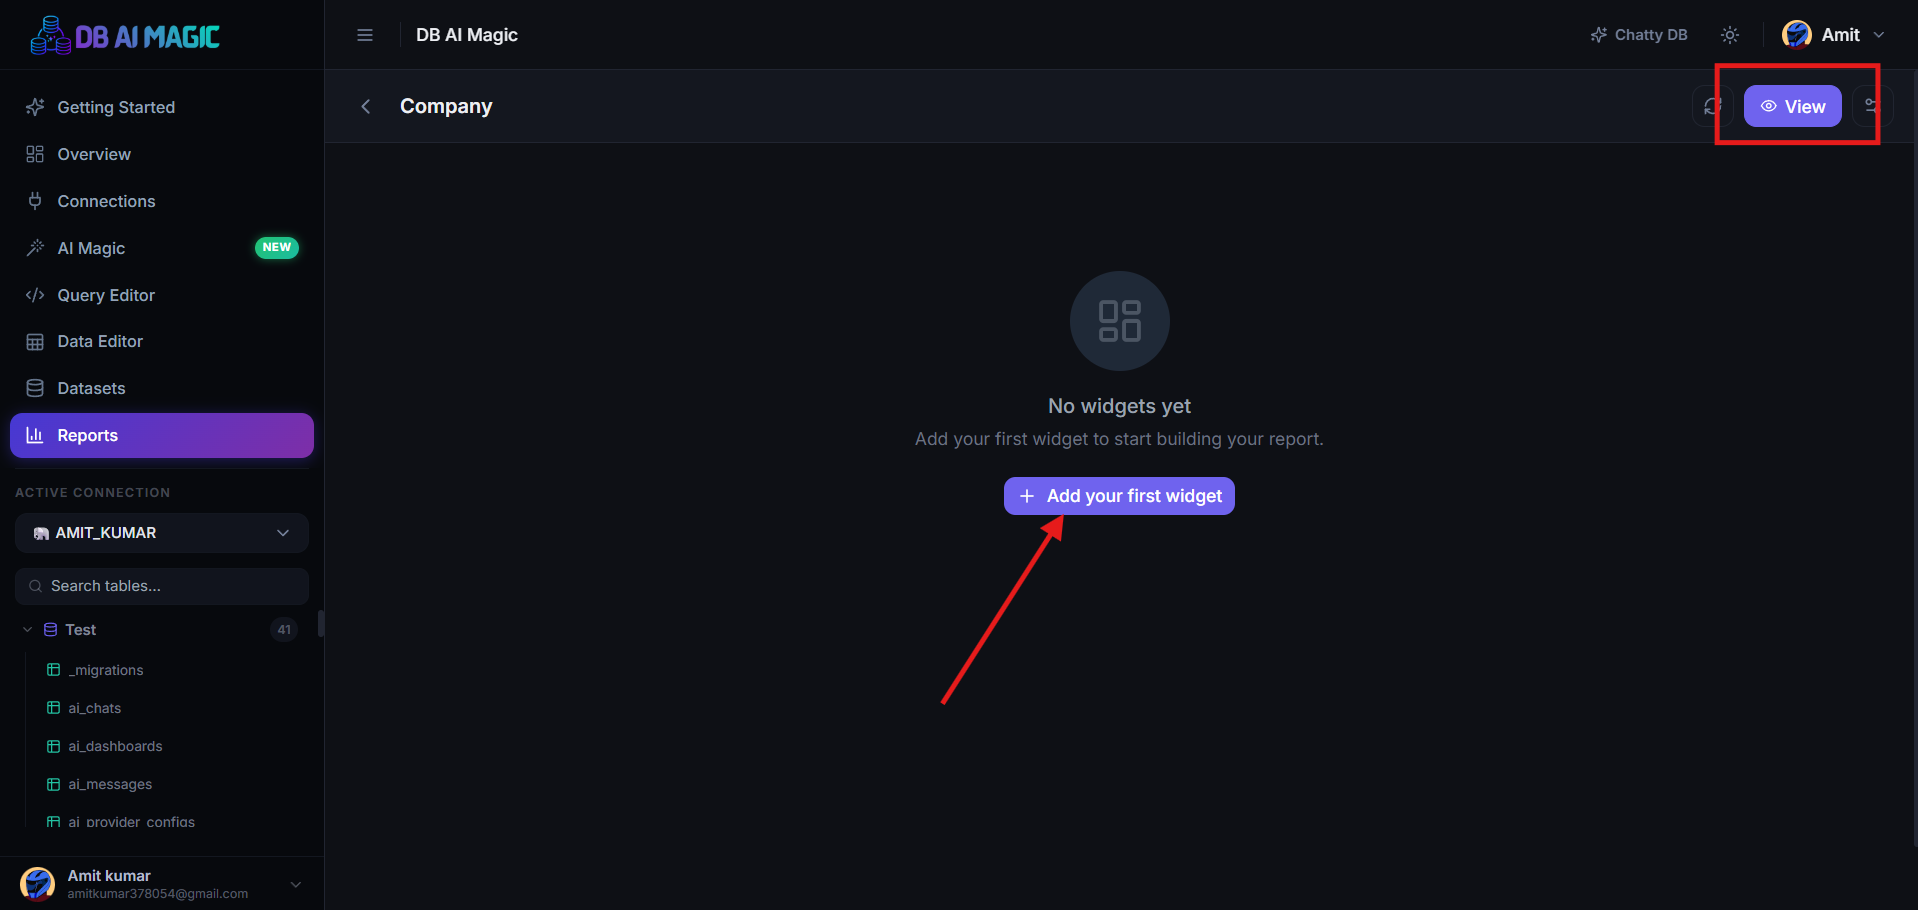
Choose the dataset that will back this report. You can add more datasets later — each widget can use a different one.Add the first widget
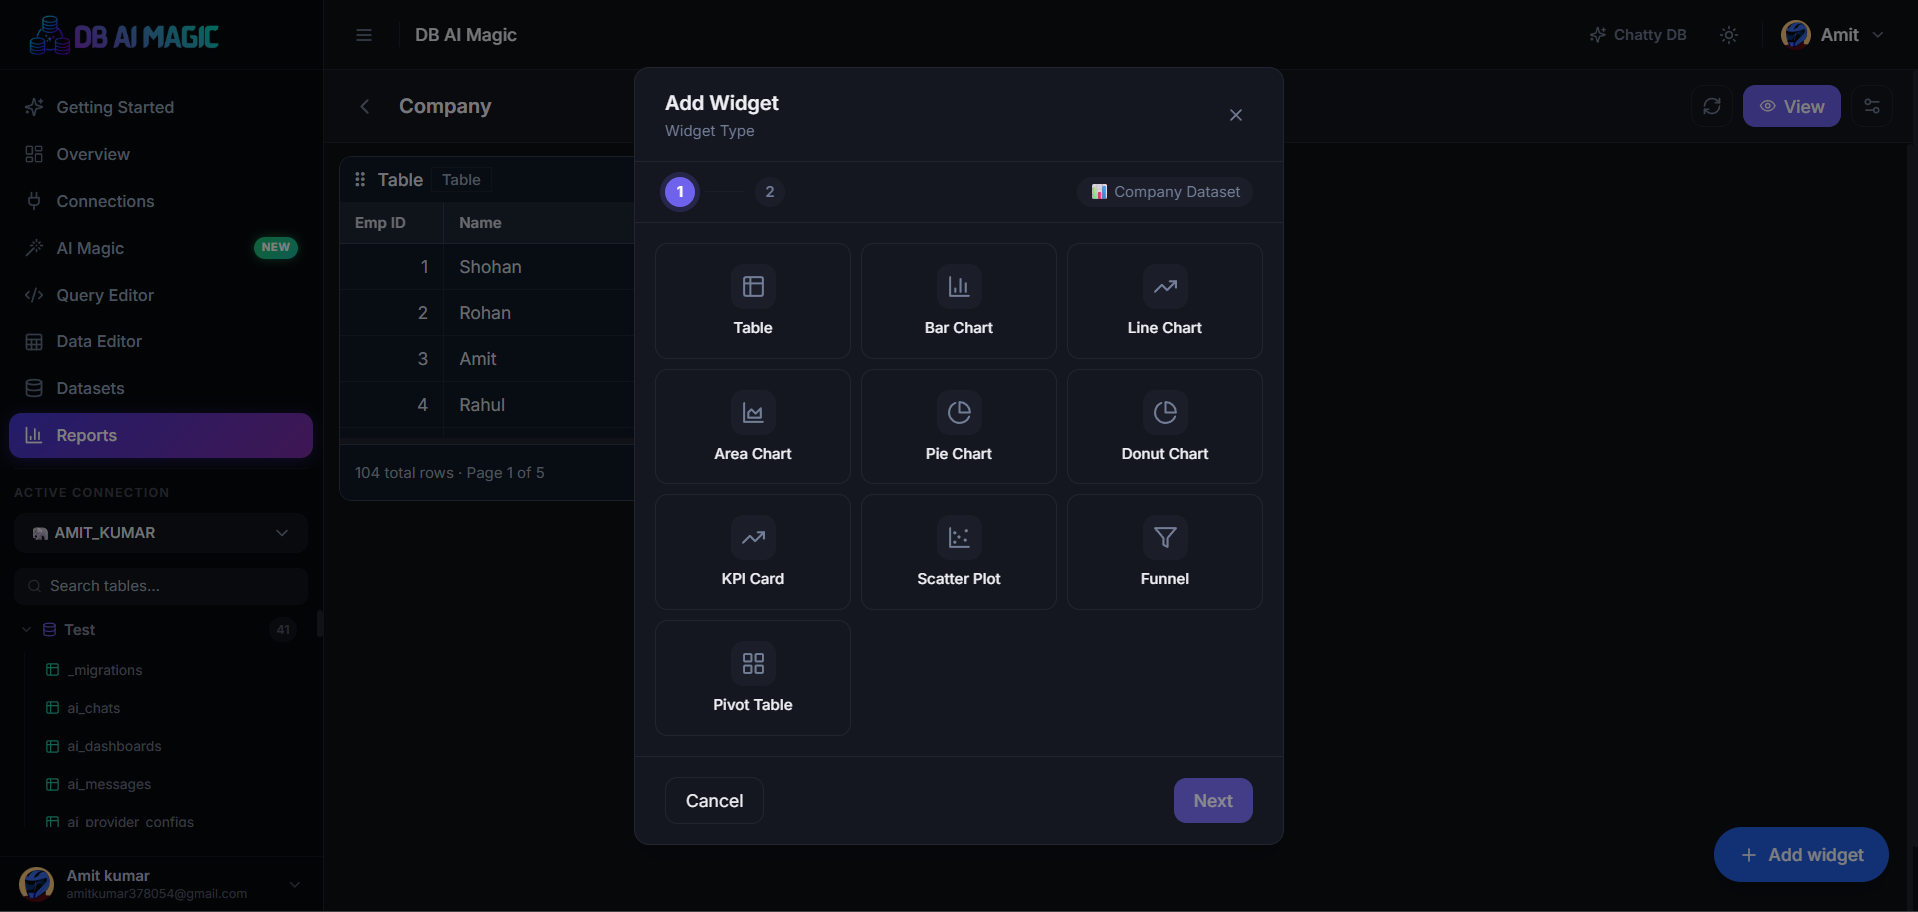
Click Add widget, pick a type (KPI, table or chart) and choose the columns to display.Lay out the grid
Drag the widget's corners to resize. Drop new widgets where they fit best. The grid snaps to a flexible 12-column layout.Save
Hit Save. The report appears in the Reports hub and stays in private until you share it.
Layout & resizing
Reports use a responsive grid. On desktop you get 12 columns of space; on mobile widgets stack one above the next automatically. If you want a specific arrangement on mobile, switch to the Mobile preview tab and adjust there — desktop layout stays untouched.
Symmetry helps
Adding filters
From the filter bar at the top click Add filter. Pick the column, choose the input type (dropdown, date range, search), and select which widgets it should affect. Filters can be marked as required so readers must pick a value before the widgets render.
Filter types
- Search — free-text match against a column
- Dropdown — pick one or many values from a column
- Date range — preset windows or custom range
- Number range — min / max sliders
Duplicating a report
From the Reports hub use the kebab menu on any report and pick Duplicate. You get a private copy with the same widgets and layout — handy for templating monthly reports.